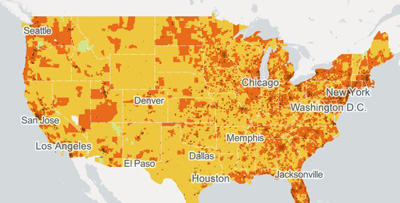
National Broadband Map has Helped Chart Broadband Evolution
When NTIA launched the National Broadband Map in 2011, American consumers and businesses had few places to turn to when trying to determine who offered broadband in their communities. The National Broadband Map has not only filled that void but has helped detail the evolution of broadband in the United States as providers upgrade or expand their networks to meet the growing demand for faster broadband.
For the last five years, each state, territory and the District of Columbia has collected the broadband availability data that powers the National Broadband Map with the help of grants funded by NTIA through the 2009 American Recovery and Reinvestment Act. Every six months, states have submitted to NTIA data compiled from information gathered from broadband providers, public and commercial data, consumers and local governments. Today, we are releasing updated broadband map data, current as of June 30, 2014.

This map displays availability of higher broadband speeds across demographic characteristics
